
To determine whether convertible bonds might be a performing tool to outperform equity in the current context, let's consider the insights provided by the indicators asset allocators regularly use: the equity risk premium (ERP), the Shiller PE or CAPE ratio, and the U.S. Treasuries yield curve. Each of these indicators gives us a piece of the larger investment puzzle with a first hint that when Equities start being pricey, switching into Convertible bonds might be a rational and efficient investment decision.
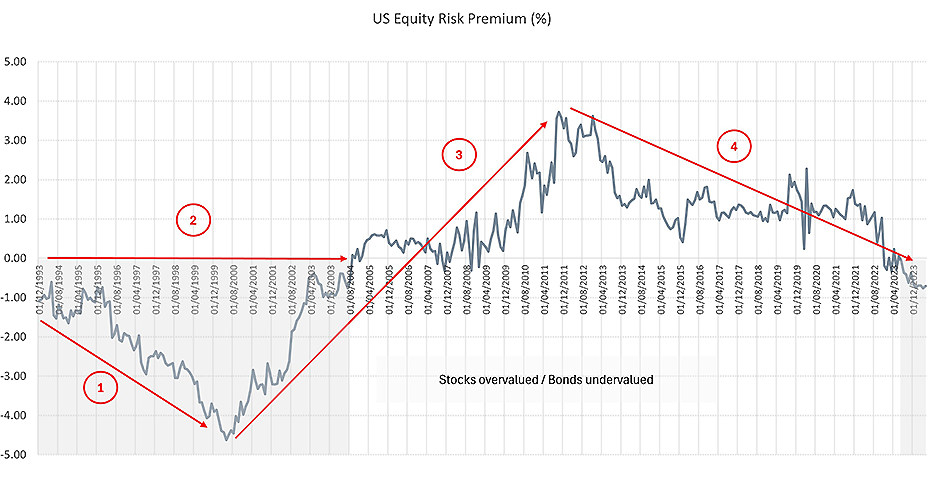
The equity risk premium (ERP) is a fundamental concept in finance, particularly in the context of asset allocation. It refers to the extra return that an investor expects to earn from holding equities over a risk-free asset. The equity risk premium is the difference in expected returns between a risky asset class, typically equities (stocks), and a risk-free asset, such as government bonds. The idea is that investors require a higher return for taking on additional risk. The ERP can be estimated in several ways, most commonly through historical averages or forward-looking models. The historical approach involves looking at the historical returns of stocks and risk-free rates, while forward-looking models might use current market data and expectations about future earnings and economic conditions.
Investors use the ERP to determine if the potential higher returns from equities justify the additional risks compared to safer investments. Financial advisors and portfolio managers use the ERP to tailor investment strategies according to an individual's risk tolerance, investment horizon, and financial goals. For instance, a higher ERP might lead to a recommendation for a heavier allocation to equities for investors with a longer time horizon and a higher risk tolerance.
In asset allocation, understanding the equity risk premium is crucial as it helps to explain how different types of investments might behave under various economic scenarios, aiding in constructing a diversified investment portfolio that aligns with the investor's expectations for returns and their capacity to bear risk.


During periods of low or declining ERP, indicating higher equity valuations, CBs provided competitive returns with lower risk compared to equities. During periods of high or rising ERP, indicating market uncertainty or corrections, CBs significantly outperformed equities by minimizing losses and providing stable returns.
The Shiller PE or CAPE (Cyclically Adjusted Price to Earnings) ratio is a valuation measure typically used to assess whether a stock market or an individual stock is overvalued, fairly valued, or undervalued. Developed by economist Robert Shiller, this ratio offers a more robust metric compared to traditional PE ratios by accounting for cyclical fluctuations in earnings. Here's a detailed look at its utility:
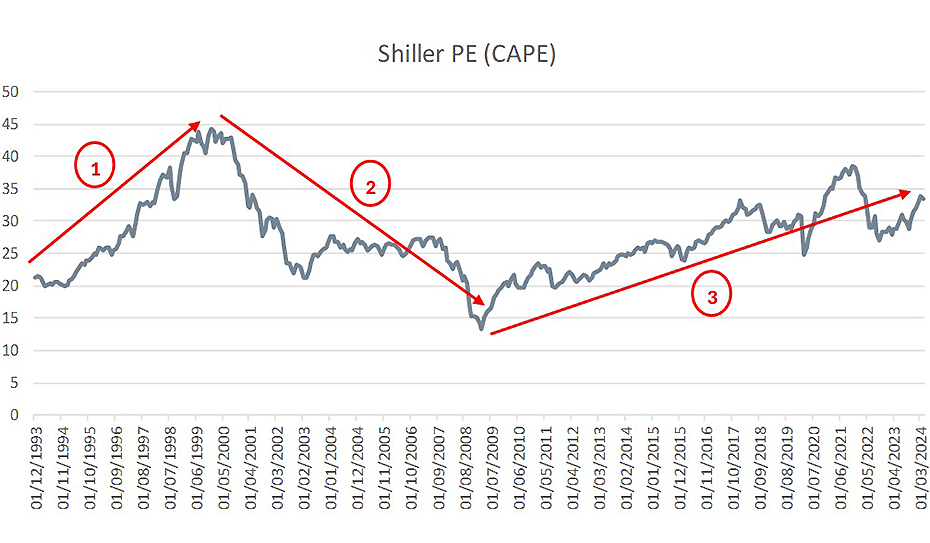
The CAPE ratio is calculated by dividing the current market price of stocks by the average inflation-adjusted earnings over the previous 10 years. This adjustment smooths out the effects of economic cycles, providing a more stable earnings base for comparison. The CAPE ratio is particularly useful for observing long-term trends in market valuation. By comparing the current CAPE ratio to historical averages, investors can gauge whether the market is generally overpriced or underpriced relative to historical norms. While not a precise timing tool, a significantly high or low CAPE ratio can suggest times of caution or opportunity, respectively. For instance, a high CAPE ratio might suggest that the market is overvalued, leading to increased risk of a downturn. Investors might adjust their investment portfolios based on CAPE assessments, possibly reducing equity exposure when the CAPE ratio is high and increasing it when the CAPE ratio is low. Overall, the Shiller PE ratio is a valuable tool for investors seeking to make informed decisions based on the relative value of stocks. It helps in crafting a long-term investment strategy that considers the potential for future returns and inherent risks. However, like all analytical tools, it should be used in conjunction with other data and qualitative factors to make comprehensive investment decisions.


From 01/12/1993 to 01/01/2000 period of rising CAPE (indicating potentially overvalued stocks), both CBs and equities performed well, with CBs slightly outperforming equities. This shows that CBs can capture upside potential even during periods of high market valuations. Then, between 2000 to 2009 of declining CAPE (indicating undervalued stocks due to market corrections), both CBs and equities experienced negative returns. However, CBs had significantly smaller losses compared to equities, demonstrating their lower risk profile and better capital preservation during market downturns. The Shiller PE ratio gradually increased post-2009, reflecting the recovery from the financial crisis and a prolonged bull market. Rising CAPE, indicating increasing stock valuations, CBs outperformed equities significantly. This suggests that CBs not only provide downside protection during corrections but also offer competitive returns during market recoveries and bull markets. During periods of declining CAPE, indicating market corrections and undervalued stocks, CBs had smaller losses compared to equities, showcasing their stability and lower risk.
The U.S. Treasuries yield curve is an essential indicator in the financial world, particularly for asset allocators. It represents the yields of U.S. Treasury securities across different maturities, typically ranging from one month to 30 years. The shape of the yield curve is a widely watched indicator, providing insights into economic expectations, interest rate trends, and potential investment strategies. The yield curve is a powerful predictor of economic conditions. A normal yield curve suggests economic expansion, encouraging asset allocators to invest in riskier assets like stocks. Conversely, an inverted yield curve suggests a recession is likely, prompting a shift towards safer, fixed-income assets to preserve capital. The yield curve helps in risk assessment and management by indicating potential volatility and economic downturns. Asset allocators use this information to adjust the risk levels in their portfolios, possibly increasing allocations to bonds when the yield curve inverts. Overall, the U.S. Treasuries yield curve is a crucial tool for asset allocators, providing valuable signals about the economic outlook, interest rate environment, and optimal asset allocation strategies. It aids in making informed decisions that align with economic cycles and market conditions, helping to optimize returns and manage risk effectively.


During the period of rising yields and a steepening yield curve, both CBs and equities experienced negative returns, but CBs had significantly smaller losses compared to equities, highlighting their relative stability. During this period of yield curve flattening, equities outperformed CBs, but both provided strong returns. CBs still offered substantial gains with lower risk.
In conclusion, convertible bonds are a strategic investment choice that balances the potential for growth with the need for stability and risk management. They are well-suited for various market conditions, making them an essential component of a diversified investment portfolio. Convertible bonds could indeed be a strategic tool for outperforming equities in the current context, especially for investors seeking to balance risk while maintaining exposure to potential equity upside. They offer a compelling alternative by mitigating downside risks while providing a pathway to participate in stock market gains, which is particularly attractive in a volatile or uncertain economic environment.
DISCLAIMER
The views and opinions expressed are for informational and educational purposes only, as of the date of production/writing and may change without notice at any time based on numerous factors, such as market or other conditions, legal and regulatory developments, additional risks and uncertainties and may not come to pass. This material may contain “forward-looking” information that is not purely historical in nature. Such information may include, among other things, projections, forecasts, estimates of market returns, and proposed or expected portfolio composition. Any changes to assumptions that may have been made in preparing this material could have a material impact on the information presented herein by way of example.
Past performance is no guarantee of future results. Investing involves risk; loss of principle is possible.
All information has been obtained from sources believed to be reliable, but its accuracy is not guaranteed. There is no representation or warranty as to the current accuracy, reliability or completeness of, nor liability for, decisions based on such information and it should not be relied on as such.
Nothing on this communication shall be considered a solicitation to buy or an offer to sell a security, or any other product or service, to any person in any jurisdiction where such solicitation, offer, purchase or sale would be unlawful under the laws of that jurisdiction.
This communication has been issued by Boussard & Gavaudan which is composed of the following entities:
Boussard & Gavaudan Investment Management LLP (“BGIM”) is a limited liability partnership registered in England and Wales, authorised and regulated in the U.K. by the Financial Conduct Authority (“FCA”) and registered as an investment adviser with the US Securities & Exchange Commission (“SEC”). BGIM is also registered with the US Commodity Futures Trading Commission (“CFTC”) and the US National Futures Association (“NFA”) as a Commodity Pool Operator and Commodity Trading Advisor. Boussard & Gavaudan Gestion SAS (“BGG”) is registered in France as a ‘Société par actions simplifiée’ which is authorised and regulated in France by the Autorité des Marchés Financiers (“AMF”). Boussard Gavaudan America LLC (“BGA”) is incorporated in Delaware and is registered with the SEC.
VC.45441.12316.IH
